Skip to content
  • Suomi

PROJECT LIST

  • AGROFORESTRY IN BARENTS REGION
    • BLOG
    • MEDIA
  • TREASURES FROM THE NATURE
    • BLOG
    • MEDIA
  • BERRY MACHINE
    • BLOG
    • MEDIA

Summer of Berry Machine 2022

Category: POSTS BERRY MACHINE

Summer of Berry Machine 2022

The technical work of the Berry Machine project was kicked off the previous year, with our interns running around the forests and calculating test areas. The weather was favorable and the atmosphere was positive, and by autumn we received a lot of material, about 10,000 images and hundreds of calculated test areas to be processed for Berry Machine.

In the summer of 2021, several cameras were used to photograph the berries; system camera and high- and low-end camera phones. Photos were taken from the top of the test plots and close-up photos for berry-free annotation. Using the acquired footage, the artificial intelligence was taught to identify different types of berries in the image: ripe, raw and in bloom. With the snow melting and spring already at the door, the year’s development work was already full. As the project progressed, its goals and needs in terms of machine learning began to become clearer, and the most important development targets were put under the magnifying glass.

Refinement of density calculation

Artificial intelligence determines the density of the berries using the berries visible in the pictures. Here, a linear regression curve is used, which is formed on the basis of the collected image and berry counting material. In practice, this means that the berries shown in the picture are multiplied by the coefficient of the curve obtained from the standard deviation, which varies according to the type of berries depicted.

Linear regression curve. The closer the reading is to 1, the better the correlation.

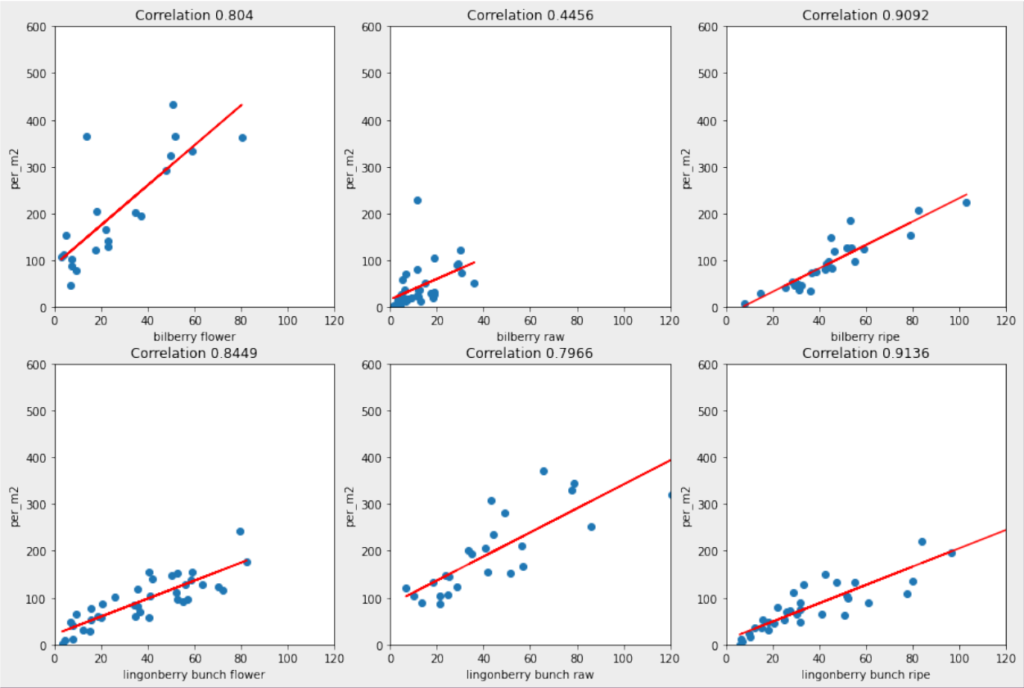
The berry machine proved to be an excellent recognizer for lingonberries and ripe blueberries, but blueberry blossoms and raw blueberries proved to be a challenge. According to our observations, artificial intelligence has difficulty distinguishing them from the background, especially when the images are wavering or overexposed, in which case it is difficult to look for them in the images even with the human eye. In addition, biases are caused by the place of growth; in the lushest places, the cover and shade of the leaves make it especially difficult to observe the raw blueberries. The above-mentioned factors make it difficult to create the most correlated coefficient for density calculation.

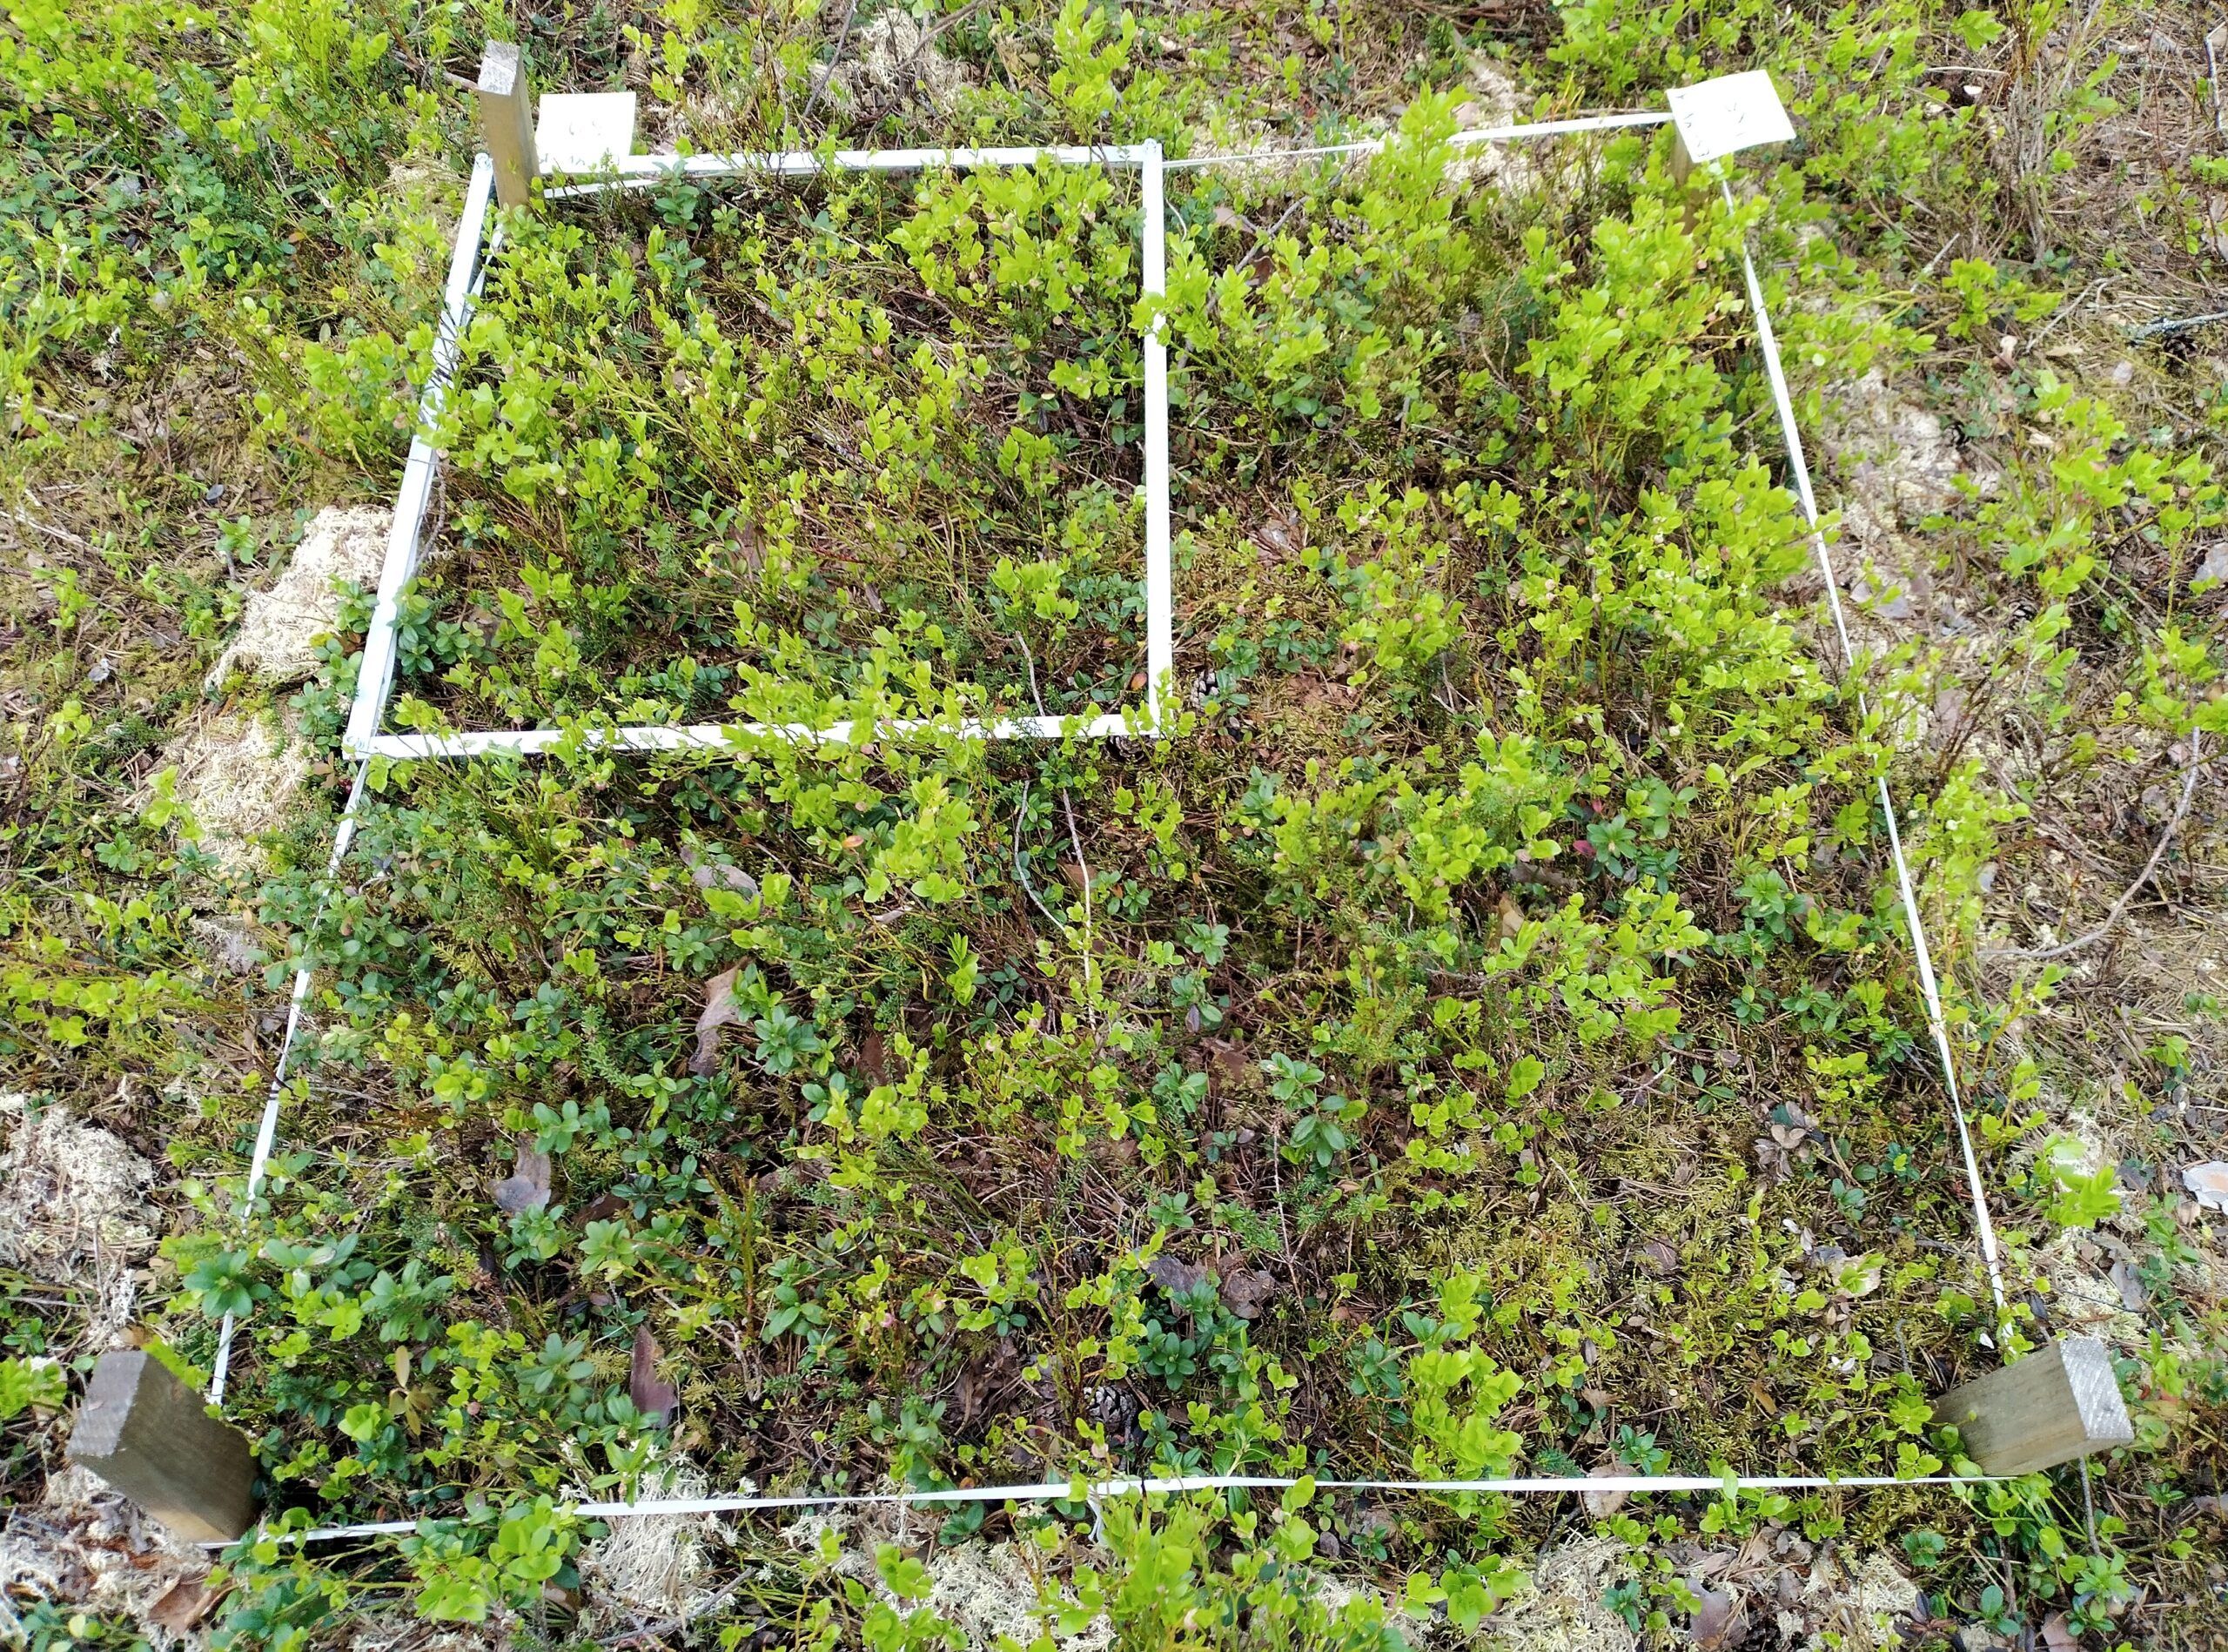
As you might expect, the help for studying the density calculation of less recognizable berry types is the larger and more enhanced data that we collected this summer. As a change from the previous summer, we also photograph smaller areas inside the test squares, which I hope will improve the algorithm in terms of density calculation. It is possibly easier to spot the berries in pictures taken closer. For filming, we prepared 50cm*50cm frames, which we use in connection with counting and filming test squares.

¼ frames are placed in the inner corner of the 100cm*100cm test plots and their berry amounts are counted separately and both are photographed from above and from each corner. The data from the small frames is combined with the data from the large frames, which can be used to compare how close the photographing affects the berry density.

The berry quantities of the larger and smaller frames are marked on the labels for photographing.

The area of the images

Up until now, the area of the pictures has been determined based on the size of the berries. The program thus calculates the surface area of the image in relation to the pixel size of the berries in the image. With this method, the proportions of the pictures can be a bit off, as the size of the berries varies depending on where they are grown.

The determination of the surface area of the pictures taken with the berry machine was switched to using AR-based software, which is based on level recognition. In level detection, the artificial intelligence deduces the distance of the four points in the corners of the image and can use them to calculate the surface area of the image. A more accurate surface area calculation aims to promote the accuracy of the density calculation. The application works reasonably well in an office environment, but we hope to be able to test it in off-road conditions as the summer progresses.

Annotation

We added annotations with a set of 200 images, which mainly contains blueberry flowers and raw blueberries, to refine their identification. As an exception to last year, the labeling of lingonberries has been switched to marking only the bunches, as it was challenging to distinguish individual berries from the pictures.

The project people of Berry Machine wish you a good berry summer, which, based on the observations made in the forest, seemed to be really great!

Posted on 24.11.202224.11.2022Posted in POSTS BERRY MACHINE

Summer’s done! – A few words about the production of the berry photo dataset and object recognition

Tuomas Valtanen & Mikko Pajula

The objective of the BerryMachine –project is to create a technological prototype, with which it is possible to recognize the condition of the current berry harvest based on the amount of berries within a photo. This challenge will be tackled by using the principles of machine and deep learning, which typically require a large image dataset to train the artificial intelligence to recognize different objects from a photo efficiently.

Our technological work got the real kickstart during the summer of 2021, when the original berry photo dataset was produced. The contents of the dataset consist mostly of bilberry photos, although a portion of lingonberry photos exist as well. At the time of writing, there are approximately 10000 photos in total, containing vast amounts of pictures of berry flowers as well as raw and ripe berries.

The lighting and zoom level of the photos differentiate throughout the dataset.  The reason for this is machine learning itself, since it is optimal to have a dataset as diverse as possible. The changes in lighting comes naturally due to the weather of different days, but the zooming levels were distributed into three different categories. These categories are close-ups, mid-range photos and the photos containing the whole measurement square frame. To add more diversity into the dataset, multiple photographers were producing the material with multiple different devices (smartphones and SLR cameras).

The machine learning model trained to recognize berries within photos will be built by using neural networks. A neural network is a computational model of the process how a system mimicking a human brain functions. In other words, by using neural networks, we can loosely model the process on a computer, how human brain actually learns. This learning process can be applied in image recognition with a special neural network structure.

Typically, a neural network aimed for image recognition is trained with a dataset, where the recognized objects are predefined beforehand. In addition to taking the actual pictures, another part of preparing the dataset is to mark down recognized objects by human hand. In other words, the personnel responsible will process through the dataset with special software, and mark down all interesting recognizable objects, which in this case are berry flowers as well as raw and ripe berries. This process is commonly called as “annotation”, for which multiple different software solutions exist.

In the BerryMachine –project, Label Studio was selected as the annotation software. The reasons for selecting Label Studio were its clarity, the safe storage of the produced annotation data and its network capabilities. Since Label Studio functions via network, it allows multiple personnel to annotate the same material simultaneously, which prevents us from doing redundant work and moving around image files and annotation data needlessly.

A screenshot of Label Studio

Performing a single annotation in Label Studio is done by drawing a rectangle on top of a recognized feature. The annotation process itself is simple, but provides multiple challenges:

  • How large should the annotated area be?
  • Should we annotate unclear situations?
  • How should we annotate small or distant targets?
  • What should we do, if for example, we can’t differentiate different flowers from each other?

Lingonberry was especially difficult in the recognition phase, since it produces the berries in bunches. In the flower phase, if the photo is overexposed, it is almost impossible by a human eye to recognize closely bunched flowers.  This “special case” of the lingonberry was solved by creating a separate classification for a lingonberry bunch. This was also created for other lingonberry growth phases.

Counting berries via bunches can be challenging, since the amount of flowers or berries within a bunch can be ambiguous. On the other hand, it might be possible for the machine learning model to recognize bunches better than single berries, which could add to the accuracy of the recognition because of the greater amount of recognized bunches. However, this can lead to a compromise, where we have to estimate the average amount of berries by the size of the bunch.

Example of a situation, where a bunch proves to be problematic to recognize

Within the BerryMachine –project, the personnel performing the annotation were given instructions to crop the target as accurately as possible, while performing within acceptable time limits and ensuring all needed information were included. Unclear targets are only annotated, if the person doing the annotation has exact information about the target’s content. Small and distant targets are only marked, if there are enough pixels within the source photo material.

Photos taken from the highest zoom level are especially interesting. In these photos the berries are small, but still easily recognizable by human eye.  Thanks to modern smartphone cameras, the image quality and especially the pixel density allows us to distinquish between small details within the photo.

An example of a photo, which has been taken from the highest zoom level

The frame shown in the photo is the berry measurement square frame, which is used to calculate the amount of berries within a square meter area.

While annotating bilberry photos, we also realized other berries (for example, crowberries) that are not recognizable targets in the project, can be present in the photos. Crowberries are fairly recognizable, but e.g. bog bilberries are very difficult recognize, unless the person performing the annotation is an actual agrologist. For the first versions of the machine learning model, these extra berries are not taken into account at all. However, if they prove to be problematic for the results of the recognition of other berries, there are methods that prevent the machine learning model to recognize them incorrectly.

When the annotation process has been finished, we can export the annotation data into a digital format, which can be used to train the selected neural network.

An example of the digital annotation data

The output of the annotation software is a digital file, which can be applied to the learning process of the neural network. The data includes, e.g. the person responsible for the annotation, information about the photo as well as the coordinates the recognized bilberry within the photo.

In the first phase, the neural network will be trained to recognize the type of berries, after which, the possibility of counting the amount of the berries within the photo will be investigated.

As the autumn proceeds, the people at the FrostBit Software Lab have a lot of work to do in order to process all of the image dataset, especially when more photos might appear later on. But so what, it’s better to have too much than too little data, at least when it comes to machine learning!

We are eager to wait the results of our upcoming artifical intelligence with our current photo dataset!

Posted on 31.8.20211.9.2021Posted in POSTS BERRY MACHINE

Tietosuojaseloste